Case Study: A Sustainable Texas Well For Many Generations
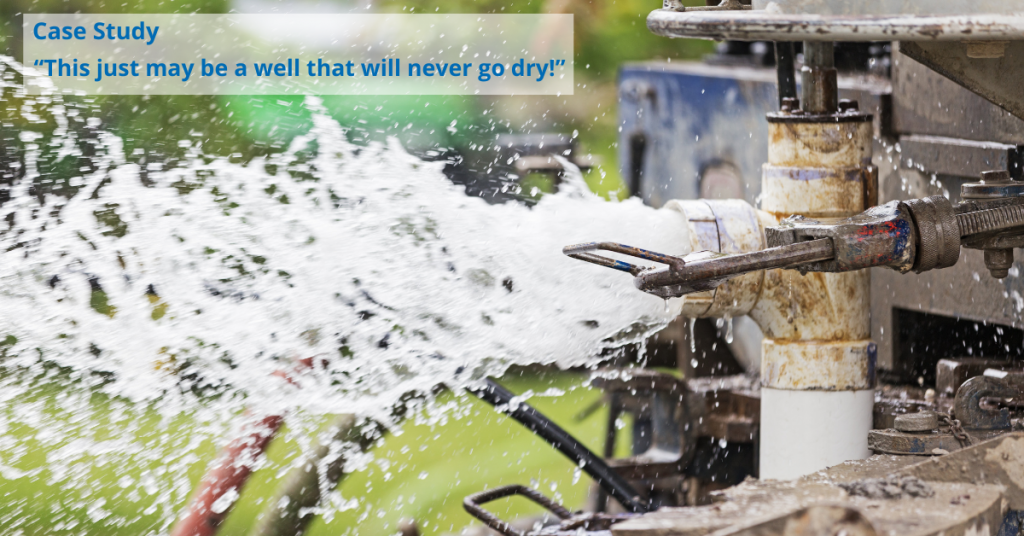
The Texas landowner was concerned about long-term drought and water contamination. Utilizing our Deep Seated Water (DSW) technology, we found a sustainable, pure source of water that needs no treatment or filtering. In fact, our senior Hydrogeologist said:
“Based on DSW method and best practices in water management, this well will service this property for many generations to come with no risk of overdrawing.” – ArlinC. Howles; PG, CPG –Senior Geologist/Hydrogeologist
Rural Texas Drought and Water Security Background
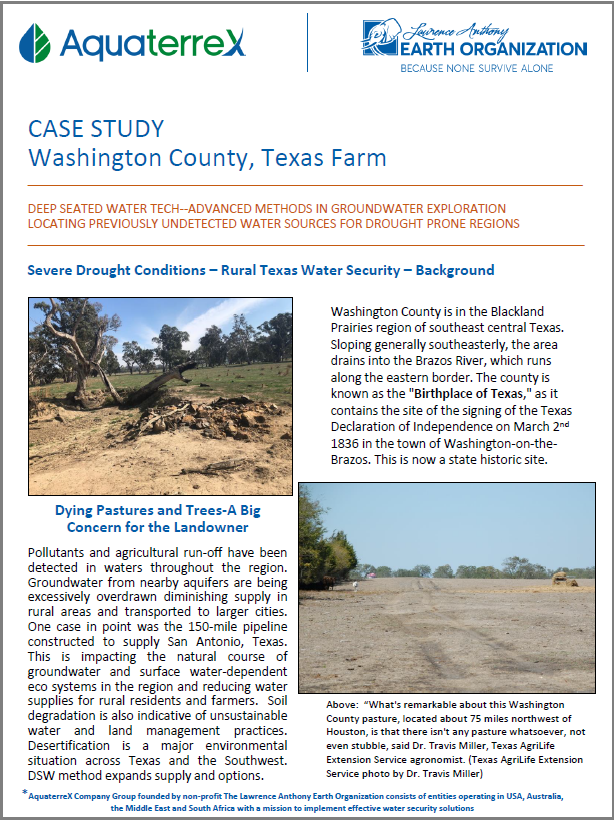
Washington County is in the Blackland Prairies region of southeast central Texas. Sloping generally southeasterly, the area drains into the Brazos River, which runs along the eastern border. The county is known as the “Birthplace of Texas,” as it contains the site of the signing of the Texas Declaration of Independence on March 2nd, 1836 in the town of Washington-on-the- Brazos. This is now a state historic site.
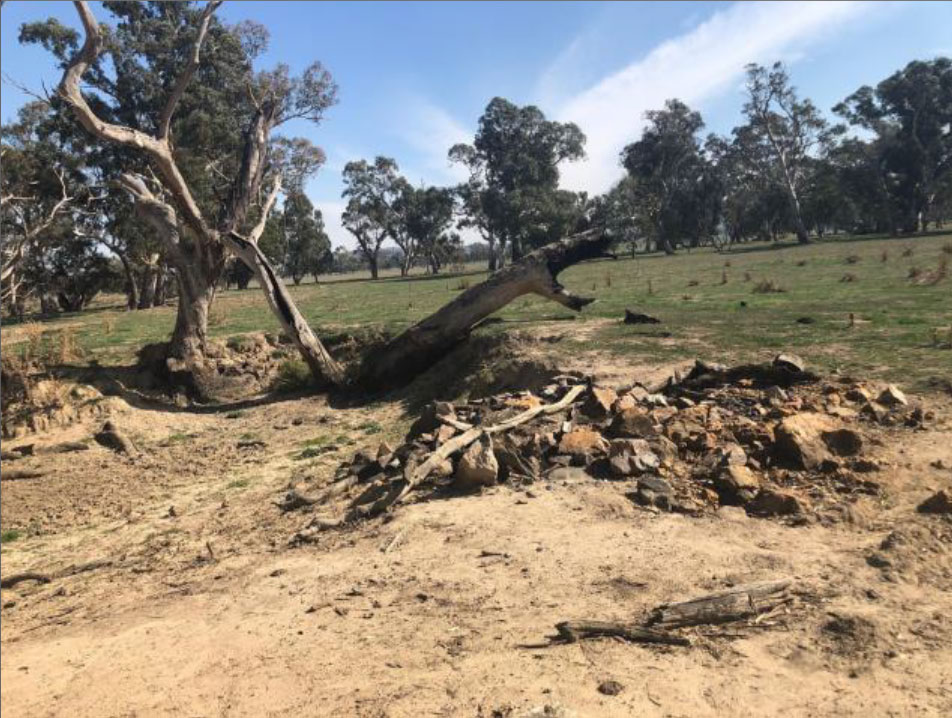
Dying Pastures and Trees – A Big Concern for the Landowner
Pollutants and agricultural run-off have been detected in waters throughout the region. Groundwater from nearby aquifers is being excessively overdrawn diminishing supply in rural areas and transported to larger cities. One case in point was the 150-mile pipeline constructed to supply San Antonio, Texas. This is impacting the natural course of groundwater and surface water-dependent ecosystems in the region and reducing water supplies for rural residents and farmers. Soil degradation is also indicative of unsustainable water and land management practices. Desertification is a major environmental situation across Texas and the Southwest. DSW method expands supply and options.
DSW Tech Exploration Methodology
This Deep Seated Water (DSW) case study report illustrates our methodology and stages of DSW exploration resulting in a clean and sustainable supply of water.
AquaterreX DSW exploration starts with our Phase I multicomponent geospatial analysis and groundwater mapping done by highly trained and experienced hydrogeologists. This results in pinpointing Areas of Interest for further investigation.
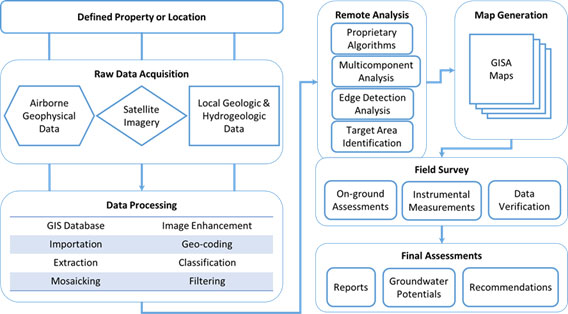
Phase II field studies are then conducted using specialized instruments that can sense and provide 3D images of what’s underground giving us visual water intelligence. The field assessment pinpoints an exact location where clean produced well water has the highest probability of occurring.
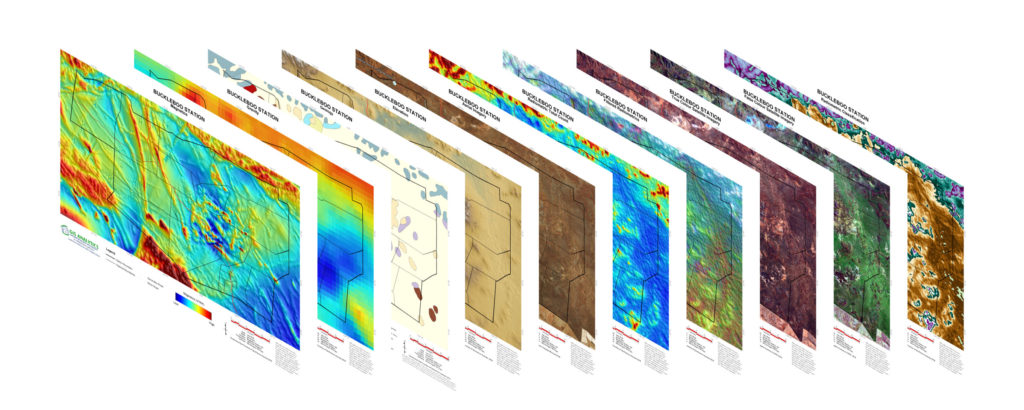
Specialized maps are created as part of the geological study and analysis.
Phase I: Where to Look for Deep Seated Water
Phase I – Hydrogeological Data Analysis & Evaluation
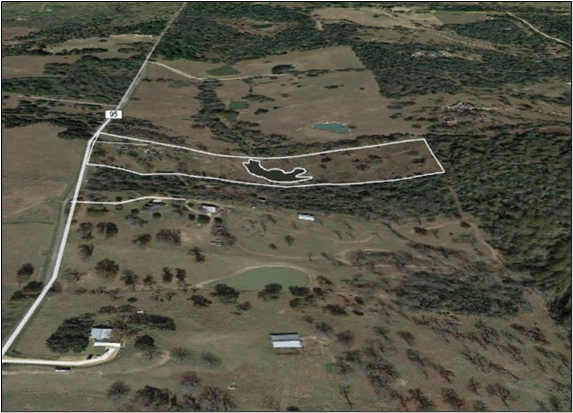
An extensive multi-component geospatial data study and water-resource specific analysis was completed on the Washington, Texas property to determine the probability for Deep Seated Water. The study indicated excellent prospects for locating a good water supply.
The geospatial data acquired and analyzed for this project included:
- Aerial Imagery
- Sentinel-2 Satellite Imagery
- Digital Elevation Model
- Regional Scale Airborne Magnetic Data
- Regional Scale Airborne Gravimetric Data
- Local Scale Geologic Data
- Maps, Profiles, and Reports from official sources (e.g., Texas Groundwater Development Board).
We recommended commencing the next phase of DSW exploration entailing our hydrogeology team to the property for an in-depth, on-site assessment.
By identifying the optimal fracture zones, we dramatically increased the probability of higher flow-rate wells and minimized overdrawing shallow and surface water resources while reducing the financial risk of drilling dry hole or low production wells.
Phase II: Take a Closer Look Underground
The next step is field data acquisition for a detailed observation of the surface features and geophysical and geological data collection and sampling. During this investigation, an initial large-scale 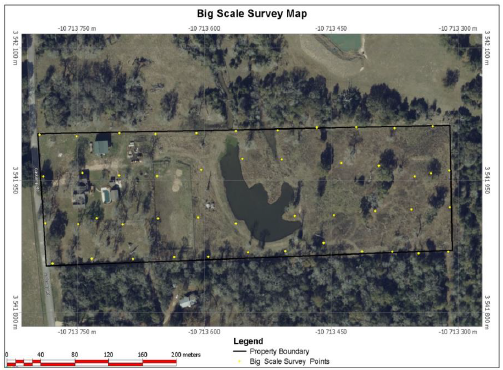 grid pattern shows where we collected data. This produced an underground view of where to look more closely. Further geophysical data was collected using Resonance Acoustic Profiling and computer elaboration of data.
The geophysical data acquired and analyzed for the project included:
- 48 data points were collected over a large grid pattern which delineated an anomaly near the center of the property.
- Over 105 data points were collected over a detailed grid located over the anomaly which the data shows extends to a depth of 1,000 feet.
- Maps, Profiles, and Reports from official sources were reviewed to match up field and remotely sensed data.
Research confirmed that the Jasper Aquifer (which extends under the property from northwest to southeast) as a deep-seated water-bearing horizon.
Phase II: Methodology – Subsurface Investigations
Results and Interpretation
3D models reveal a deep-reaching anomaly indicating an abrupt change of rock properties in the area around an intersection point.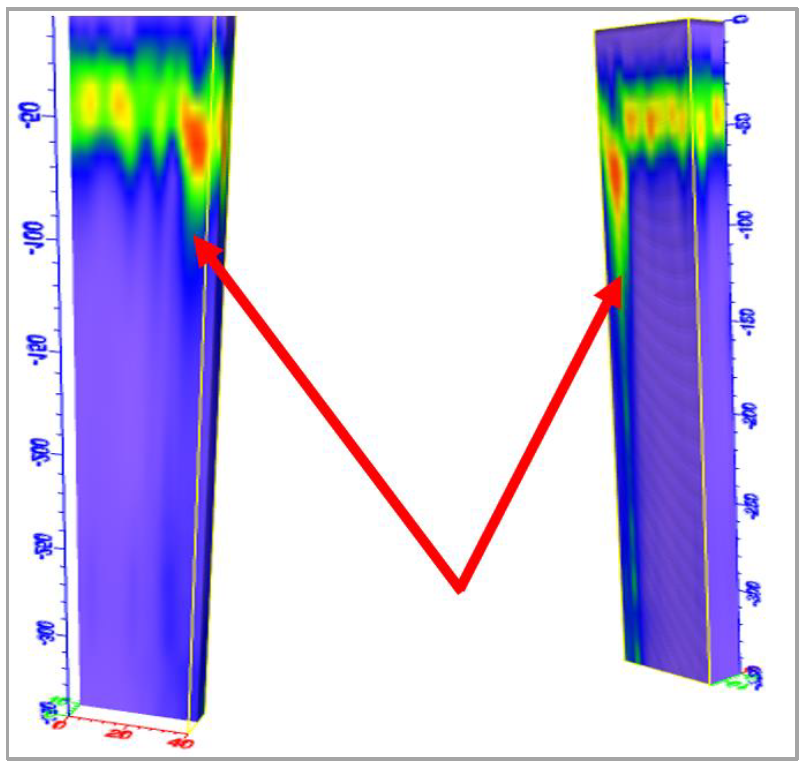
Anomalies are seen in the North-South and West-East trending 3D models.
The field survey determined the depth to and the thickness of water-bearing horizons. Results are constructed in 3D models and two-dimensional profiles to pinpoint where to drill a productive bore.
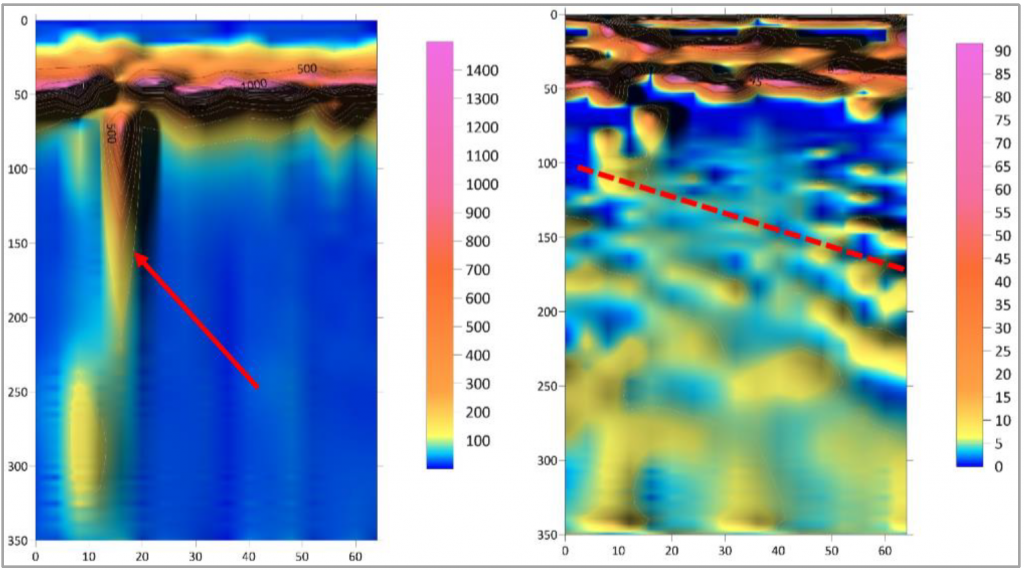
The red arrow indicates a vertical anomaly going deeper 350 meters (1100 feet) on east-west trending line 16 and the dashed line shows the assumed boundary between Burkeville and Jasper Aquifer formations along that line. Scale bars illustrate the level of rock matter disturbance (geological features associated with liquid accumulation).
Phase II: Where to Drill Precisely
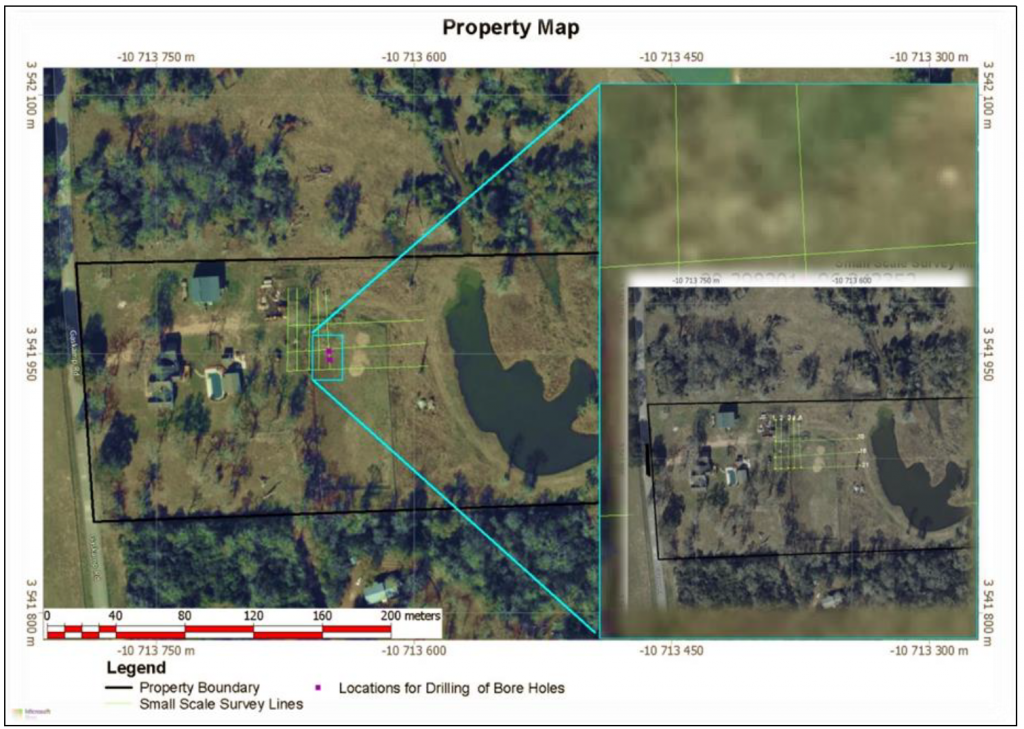
Map Image: Narrowing down to exact coordinates
The Data showed a boundary between the Burkeville and Jasper formations where the optimal depth for reaching the water-bearing horizon starts from 300 feet (91 meters) to 510 feet (155 meters).
The best location is the intersection point between NS line 5 and WE line 16 which correspond to the zone of abrupt vertical change of rock properties on the profiles 6 and 7. Coordinates of the points are given in WGS 84 Latitude Longitude format in DD°MM’ SS’’ (see fig. 10 and table 2).
Further detailed data can be found in the case study PDF appendix.
Phase III: Drilling the Well
The water well was drilled to a depth of 100 meters (328 feet).
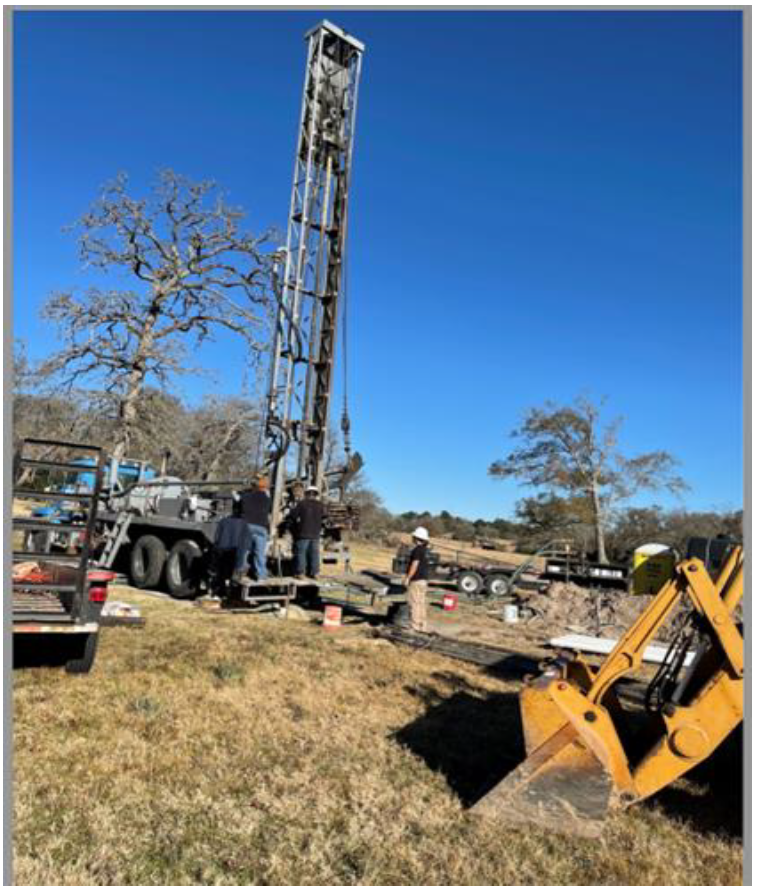
During drilling, the unconfined aquifer and second aquifer were found between 5.8 and 11.6 meters (19 and 38 feet) and 15.2 and 36 meters (50 -118 feet), respectively. The Burkeville Aquiclude (Confining Layer) was encountered between 36 – 75.3 meters (118 – 247 feet) with the underlying Jasper Aquifer found between 75.3 and 100 meters (247 – 328 feet). The Jasper Aquifer was drilled at 75.3 meters (247 feet), and the initial water level. After 24 hours, the static water level was measured at 45.72 meters (150 feet), which indicates a confined aquifer.
Once the well was constructed, it was jetted [below] to remove heavy sediment from the well. During jetting, an initial yield of 400 gpm was estimated.
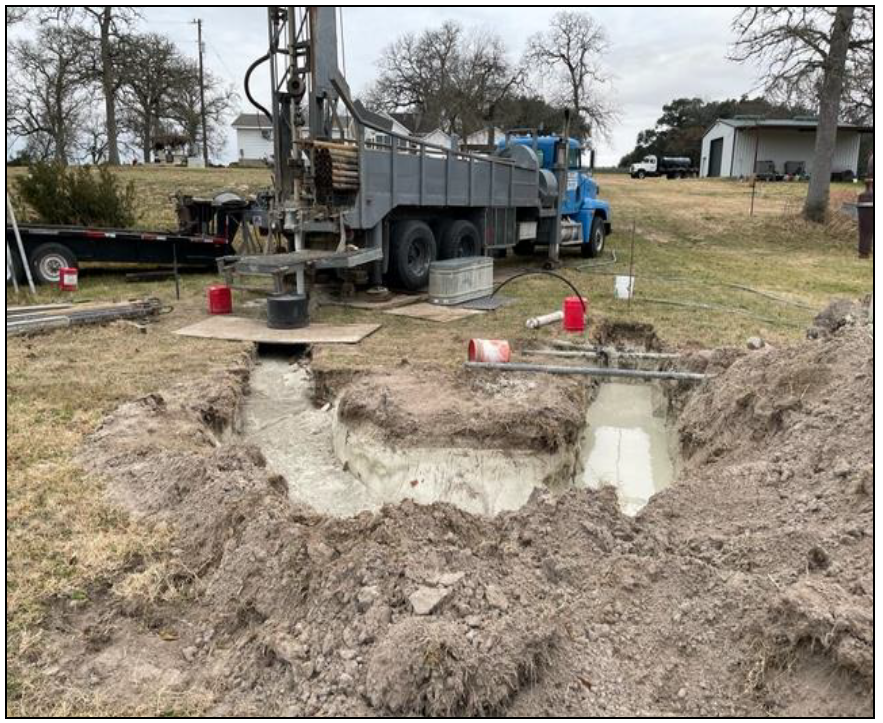
Well development included the performance of a constant rate pump test where a pump rate of 50 gallons per minute was maintained for an hour, which resulted in a water level drawdown of only eight feet.
Final Depth:
328 feet (100 meters)
Estimated Flow Rate:
400 plus gpm* (1500liters/min)
*Note: the volume of DSW water available substantially higher than 50 gallons per minute—used by the landowner. Flow was limited by client and driller’s discretion.
A Sustainable Well – For Many Family Generations –That’s DSW!
A Comment from our 40-year veteran Hydrogeologist/Drilling Engineer:
“In my opinion, this just may be a well that will never go dry.
“We drilled through to the underlying confined water-bearing formation –the water level came up to 150 feet at a drill depth of 328, and we hit the confined aquifer at 272 ft. Pressure pushed water up 122 feet—reaching the 150-foot level. By my calculations, all data points to this being a 400 gpm well or greater.
“We did the jetting of the well…the sustainable water yield test on this 4 inch well with a small pump that maxed out @ 50 gpm. During that test, the water table only came down 8 feet. In other words, it barely dropped the water table. That means we reached a robust confined aquifer.
“This well fills an 80-gallon water tank in the well house. That means the Pump will turn on for only one minute to fill that tank.
“In other words, one need only pump water 7 mins a day to service the property.
There would be no danger to the confined aquifer–you would have to pump 122 feet of water before you even got down to the bottom.
“Based on DSW method and best practices in water management, this well will service this property for many generations to come with no risk of overdrawing.”
— ArlinC. Howles; PG, CPG –Senior Geologist/Hydrogeologist
Further detailed data can be found in the case study PDF appendix.